Overview
Graph GPT is an AI-powered data visualization tool that democratizes database access by converting natural language queries into SQL executions and generating interactive charts. Developed during my Liberty Mutual internship to enable non-technical stakeholders to extract insights from complex databases.
Challenge
Business analysts and stakeholders often needed data insights but lacked SQL expertise, creating bottlenecks in data analysis workflows:
- Dependency on technical teams for simple data queries
- Slow turnaround times for data analysis requests
- Limited data accessibility for non-technical users
- Manual chart creation from query results
Solution
Built an intelligent interface that bridges natural language and database queries:
- Natural Language Processing: Leveraged OpenAI API to convert plain English to SQL
- Automated Visualization: Intelligent chart type selection based on data structure
- Interactive Dashboards: Customizable charts with drill-down capabilities
- Query Validation: Safety checks to prevent destructive database operations
Impact
Graph GPT transformed data accessibility within the organization:
- Significantly reduced data analysis turnaround time for business users
- Enabled self-service analytics for non-technical teams
- Freed technical teams to focus on complex data engineering tasks
- Increased data-driven decision making across departments
Key Features
Natural Language Query Interface
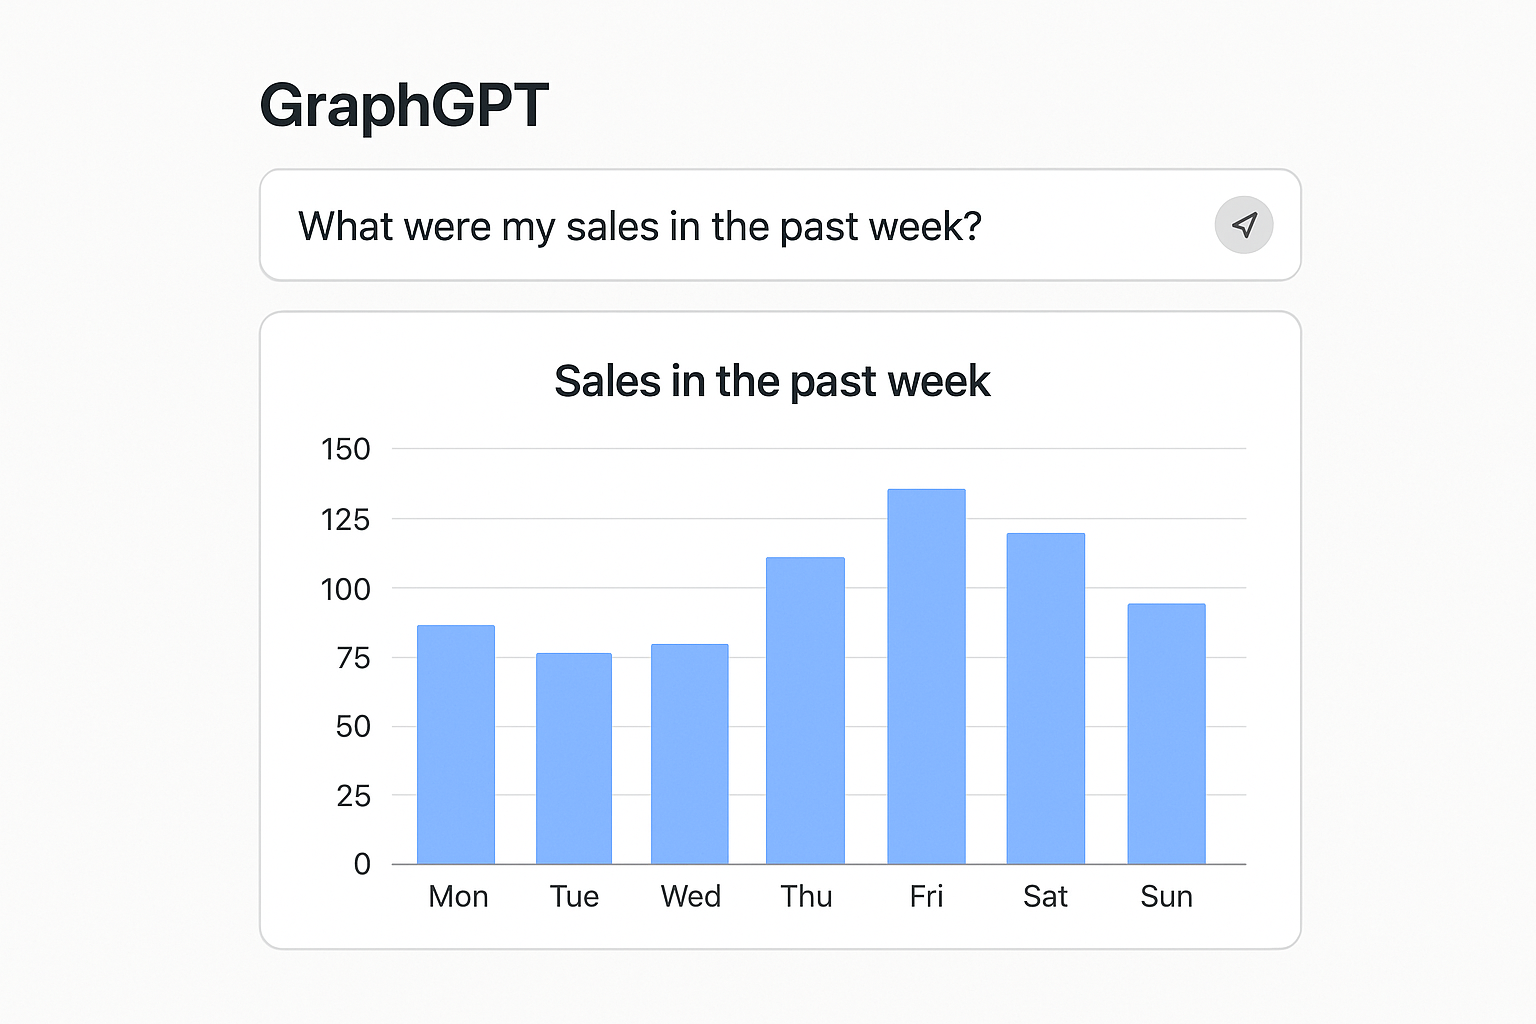
Graph GPT transforms simple English questions like "What were my sales in the past week?" into executable SQL queries and instantly generates visualizations. The system supports multiple chart types including bar charts, line charts, pie charts, scatter plots, and data tables, automatically selecting the most appropriate visualization based on the query structure. Each chart is fully interactive with customizable colors, labels, and axes, and users can download visualizations in various formats for presentations and reports.
AI-Powered Analysis and Insights
Beyond visualization, Graph GPT includes an AI analysis feature that examines generated charts and provides comprehensive feedback on the data. The system identifies potential issues such as declining sales trends, unusual patterns, or performance anomalies, and offers actionable recommendations for improvement. For example, when analyzing sales data showing a Tuesday dip, the AI might identify this as a detrimental issue to revenue and suggest targeted interventions like promotional campaigns or staffing adjustments. This transforms raw data into strategic insights, enabling stakeholders to make informed decisions without requiring data science expertise.
Enterprise-Ready Functionality
The platform includes query history tracking, saved templates for frequently-used analyses, and read-only database access with validation to prevent destructive operations. Users can filter, sort, and drill down into data directly within the interface, export both raw data and visualizations, and share insights across teams. The system maintains a complete audit trail of queries for compliance and learning purposes.